The City of Boston’s new data dashboard tracks on-demand interpretation services.As the city of Boston continues its efforts to expand access to equitable language services across the city, a new data dashboard is tracking how much the city is using translation and interpretation services.
The data tool, announced by the Office of Language and Communications Access on Dec. 1, tracks hours of services used, the number of requests made and the amount of city spending on accommodations.
“It’s an accountability tool,” said Jeniffer Vivar Wong, executive director of the office. “It’s transparency to our community members, and I think it’s also a way to say that we are going to continue to invest in the progression of language access across the city.”
The dashboard, which Vivar Wong said has been in the works for a little over a year, can serve as a tool to track how the city is doing with its language access goals, both in a general sense and in reference to specific language access resources.
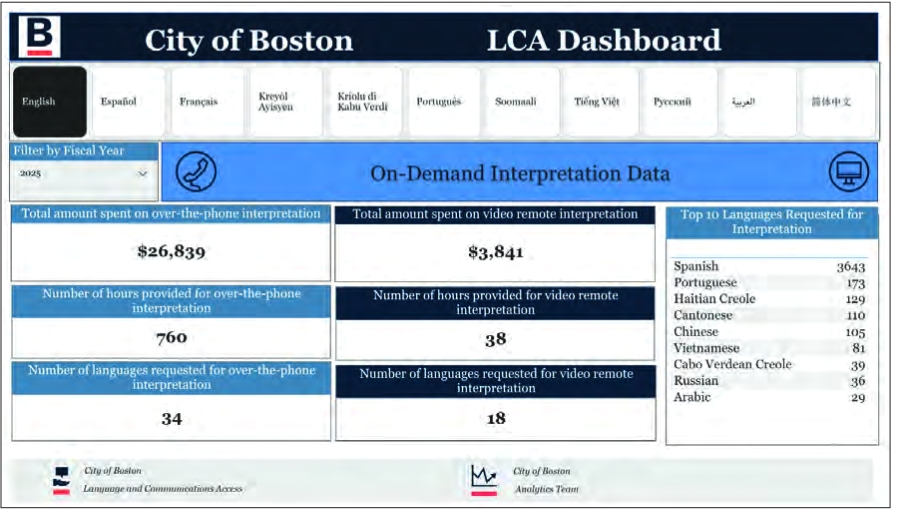
The tool tracks on-demand interpretation services — which are used when someone needs spur-of-the-moment assistance — with numbers of hours provided and dollar amounts spent on over-the-phone interpretation and video interpretation.
It also follows data for city usage of translation and interpretation services that are scheduled ahead of time, including the number of interpretation requests, the number of written translation requests, the number of American Sign Language interpretation requests and the number of requests for Communications Access Realtime Translation — a live captioning service designed for community members who are deaf or hard of hearing.
The city data broadly shows a growth in the use of translation and interpretation services in the city.
For example, the dashboard shows a significant jump in the use of on-demand interpretation services between fiscal year 2023 and 2024 — hours of on-the-phone interpretation services rose by about 61%; hours of remote video interpretation rose by over 340%.
Vivar Wong said the office has identified that rise as well and is still trying to match it to changes in programming that might suggest a reason why.
But, beyond its ability to show trends in how the city is using its language access tools, officials also described the dashboard as an important symbol of accountability for what the city is doing.
“By sharing this data openly, we’re not only increasing transparency, but also creating the foundation for smarter decision-making about where resources are most needed. It’s another step toward building a city government that meets residents where they are,” said Mariangely Solis Cervera, chief of the city’s Equity and Inclusion Cabinet, which houses the Office of Language and Communications Access, in a statement.
“When they see this dashboard, I think it’ll just reinforce that the webpage is not just describing what we could potentially do, it’s actually showing what we are doing in real time from year to year,” said Vivar Wong.
She cautioned that a decrease in the tracked data doesn’t necessarily indicate the trends are moving in the wrong direction. For example, the number of on-demand phone translation hours decreased by 12 hours from fiscal year 2024 to 2025, but Vivar Wong said that shift isn’t a change in priorities, just how programs are being implemented and resources are being accessed.
“I don’t want folks to dwell too much if they see any dips or or decreases,” Vivar Wong said.
“That does not reflect that the city is doing less. I think it might just mean that during the past few years, we have been really honing in on implementing departments, creating departmental plans, establishing new contracts, and so changes may occur. That does not mean that less language access is being provided.”
The dashboard is also the first published by the city to be released in multiple languages. Generally, to access other municipal data dashboards in other languages, users must rely on Google Translate to parse the webpage, but for this, the Office of Language and Communications Access opted to create the whole tool in 11 languages, including English.
It was a process that required extensive trial and error and contributed to the longer timeline to get the dashboard released, but Vivar Wong said professionally embedding the translations adds a layer of quality assurance and ease of access.
Ultimately, Vivar Wong said she’d hope to see similar translation efforts on other data dashboards across the city’s website, but recognizes that there’s a question of what resources are available and where they will be allocated.
In a statement, Erika Garcia, research and data manager for the Office of Language and Communications Access, called the translations a major step forward in how we approach language access.
“It’s about making sure every resident has access to the information and services they deserve,” Garcia said.
ON THE WEB
Check out the dashboard at boston.gov/departments/language-andcommunications-access#lca-dashboard
